Employee Sales Reports
Who's selling what? TORO keeps track of which employee rang every item, so you can look at one person's sales over a quarter, a month or any dates you like: their top items, which product types and brands they move, and, for owners, their hours and sales per hour. When a vendor rep asks how your staff are doing with their line, there's also an export that breaks a brand's (or a whole vendor's) sales down by employee.
This article covers two tools:
- View Employee Statistics, the on-screen report for one employee
- Export Sales by Employee for a Brand/Company, a spreadsheet for a brand or vendor
View Employee Statistics
Finding It
- Open the Dashboard
- Click the Reporting tab on the left, then click the Employee button across the top of the report area
- Click the View Employee Statistics card (Can't find it? Type "employee statistics" in the search box at the top right.)
- The Select Employees window opens. Move the employee you want to the right-hand list and click OK. You can only pick one.
The same report is also on the main screen: click Employee in the sidebar on the left, then View Sales Breakdowns By Employee, and enter your PIN.
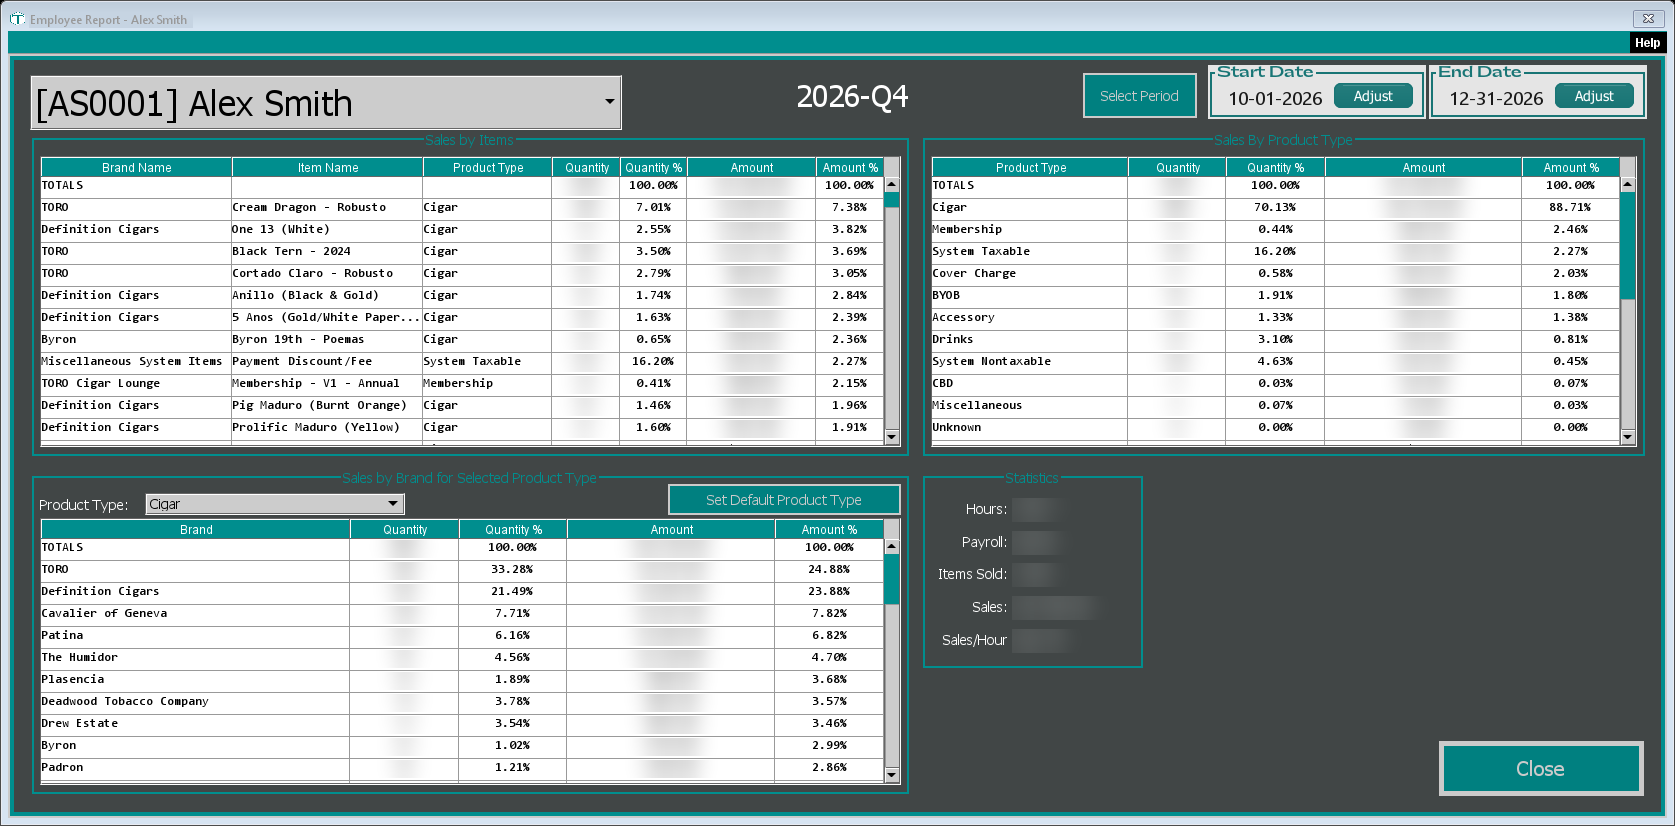
Check the name first
The box at the top left shows whose numbers you're looking at. There's a known problem here: the report opens on the first employee in that list, not the person you picked (or, from the Employee menu, not you). So after it opens, choose the employee you want from that box and the report reloads for them. The window's title bar shows the name you picked even though the numbers are someone else's until you do; always go by the box.
You can switch to any other employee the same way, without closing the report.
Choosing the dates
The report opens on the current quarter, shown in large text at the top (for example 2026-Q4). To change it:
- Click Select Period and pick a period from the list, then click OK
- Or click Adjust under Start Date or End Date to set your own dates. The heading then reads Custom Interval.
Reading the report
- Sales by Items: every item the employee sold in that period, with Brand Name, Item Name, Product Type, Quantity, Quantity %, Amount and Amount %. The TOTALS row at the top adds them up.
- Sales By Product Type: the same sales grouped by product type.
- Sales by Brand for Selected Product Type: pick a product type in the Product Type dropdown to see which brands within it the employee sold. Set Default Product Type opens a list of product types; the one you pick is shown here and this report opens on it next time. It also sets the product type that the Top Items with Top Purchasers report opens on.
- Statistics: Hours clocked in the period, Payroll for those hours, Items Sold, Sales, and Sales/Hour (sales divided by hours).
The Quantity and Amount columns and the Statistics box are only shown to people with permission to see sensitive employee report information, and only they can change the employee box. Owners and other admin users have it. Anyone without it sees only the percentage columns and can't change the employee box, so because of the problem above they see the first employee's percentages, not their own.
Export Sales by Employee for a Brand/Company
This builds a spreadsheet of who sold how much of a brand, several brands, or every brand from one vendor. It's handy for rep visits, sales contests and vendor programs.
- On the main screen, click Employee in the sidebar on the left
- Click Export Sales by Employee for a Brand/Company and enter your PIN
- TORO asks Company or Brand? Click Brand or Company (or Cancel)
- Brand: the Select a Brand window opens. Tap each brand you want, then click Select.
- Company: the Vendor Companies window opens. Click the vendor, then click Select. Every brand linked to that vendor is included, so make sure your brands are linked (see Linking Brands to Vendors).
- In the Choose a date & time window, pick the start. It starts on the 1st of the current month.
- Pick the end the same way. It starts on the last day of the current month.
TORO saves the report as a CSV file in its data\reports folder and opens it straight away in your spreadsheet program.
What's in the file
The file has two parts:
- Sales By Employee For Brand: the brands you chose, then a block for each employee who sold them. Each block lists every item they sold with its average price, quantity and total, and ends with a Totals line. All the chosen brands are combined into one block per employee.
- A list of every item across all employees, with Avg $/Item, Quantity and Total $, ending with a Totals line.
The dollar amounts are what the items sold for, before sales tax.