Sales by Product Type and Payment Type
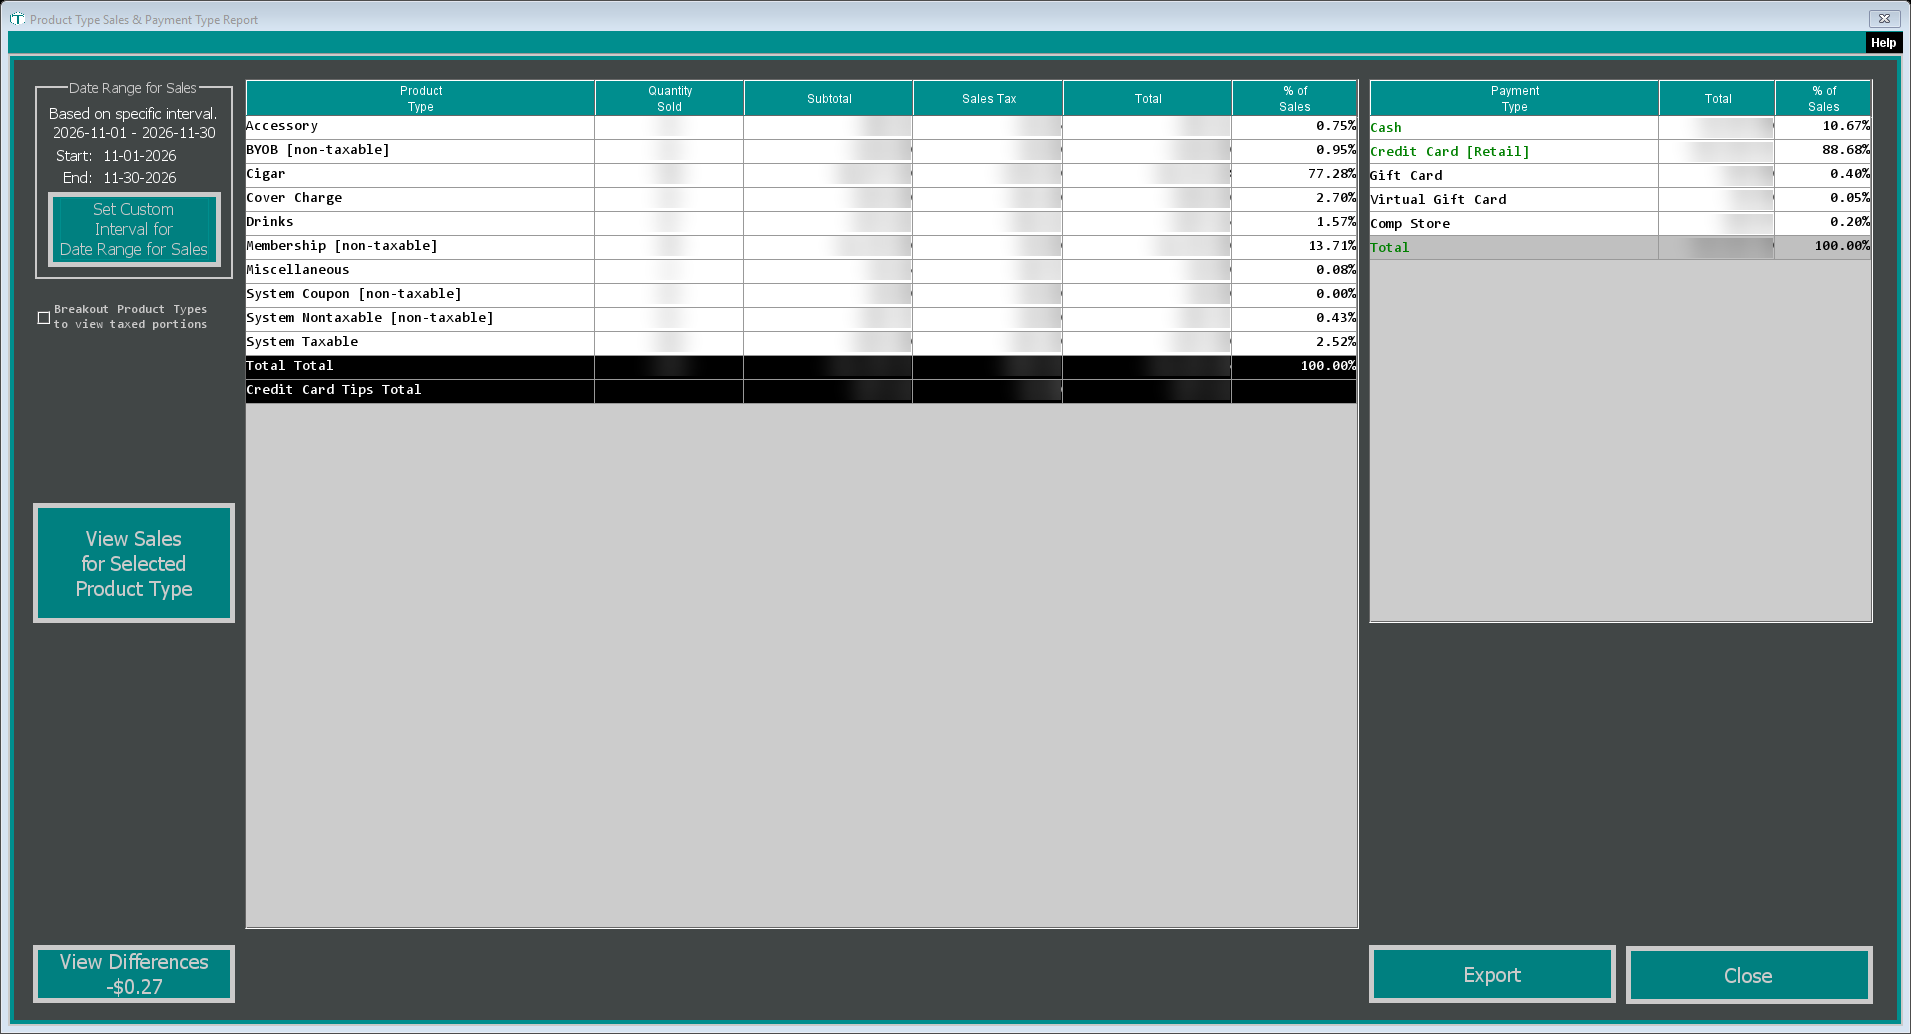
Two quick questions come up at the end of every month: "how much did we sell in each category?" and "how did people pay?" The Product Type Sales & Payment Type Report answers both on one screen. The left side breaks your sales down by product type (cigars, accessories, drinks and so on), with sales tax shown separately. The right side breaks the same money down by payment type: cash, credit card, gift card and the rest.
It's a good report to pull when you're doing your books, checking your category mix, or making sure the money you took in lines up with what you sold.
There's also a separate Sales by Payment Type window on the Admin menu that looks at a month or year at a time and lines up your cash sales against the cash you've deposited. It's covered further down.
Finding It
- Open the Dashboard
- Click the Reporting tab on the left, then click the Sales button across the top of the report area
- Click the View Sales by Product Type card (Can't find it? Type "product type" in the search box at the top right.)
Choosing the Dates
The report opens on the current month, from the 1st to the last day. The Date Range for Sales box in the top left shows the range it's using.
To look at a different stretch, click Set Custom Interval for Date Range for Sales. The Select an interval... window gives you four ways to pick:
- Last XX days, such as the last 30 days
- Last XX quarters
- Specific Quarters: a year and one or more quarters next to each other
- Specific Date Range: any start and end date
Click OK. TORO asks whether you want to save the interval for future days (either answer is fine, since this report always opens on the current month), then the report reloads.
The Product Type Table
Each product type you sold in that range gets one row:
- Quantity Sold: how many units rang up.
- Subtotal: what those items sold for, before sales tax.
- Sales Tax: the tax collected on them.
- Total: subtotal plus tax.
- % of Sales: that product type's share of the grand total.
A product type with [non-taxable] after its name collected no sales tax in that range.
Below the product types are the black total rows:
- Total Total: everything added up. This is the number to use as your sales for the period.
- Round Up Amounts Total: only shows when cash sales in that range were rounded up (see Cash Rounding). It's included in the total.
- Credit Card Tips Total: only shows when there were card tips. Tips are listed for your information and are not part of the total above.
Splitting taxed and untaxed sales
Tick Breakout Product Types to view taxed portions and every product type is split by tax: a [taxable] row for its taxed sales and a [non-taxable] row for its untaxed sales (a type with only one kind gets just that row), followed by a total row for that product type (for example Cigar Total). Two more rows appear at the bottom, Total Taxed Total and Total Not Taxed Total. This is handy when you need to report taxable and exempt sales separately. Untick it to go back to one row per product type.
Drilling into one product type
Click a product type to select it, then click View Sales for Selected Product Type. The Sales by Product Type, Item and Brand report opens for the same dates, already narrowed to that product type, so you can see which brands and items made up the number. If nothing is selected, it opens for all product types. See Viewing Sales by Brand and Item for how to read it.
The Payment Type Table
The right-hand table shows the same period by how customers paid: one row per payment type with its Total and % of Sales, and a Total row at the bottom.
When the Two Totals Don't Match
The product type side is built from the items you sold. The payment side is built from the payments you took. They should agree. When they don't, a View Differences button appears in the bottom left with the gap on it (for example View Differences -$0.27). When they match to the penny, the button isn't shown at all.
Click it to open Sales by Product Type Differences.
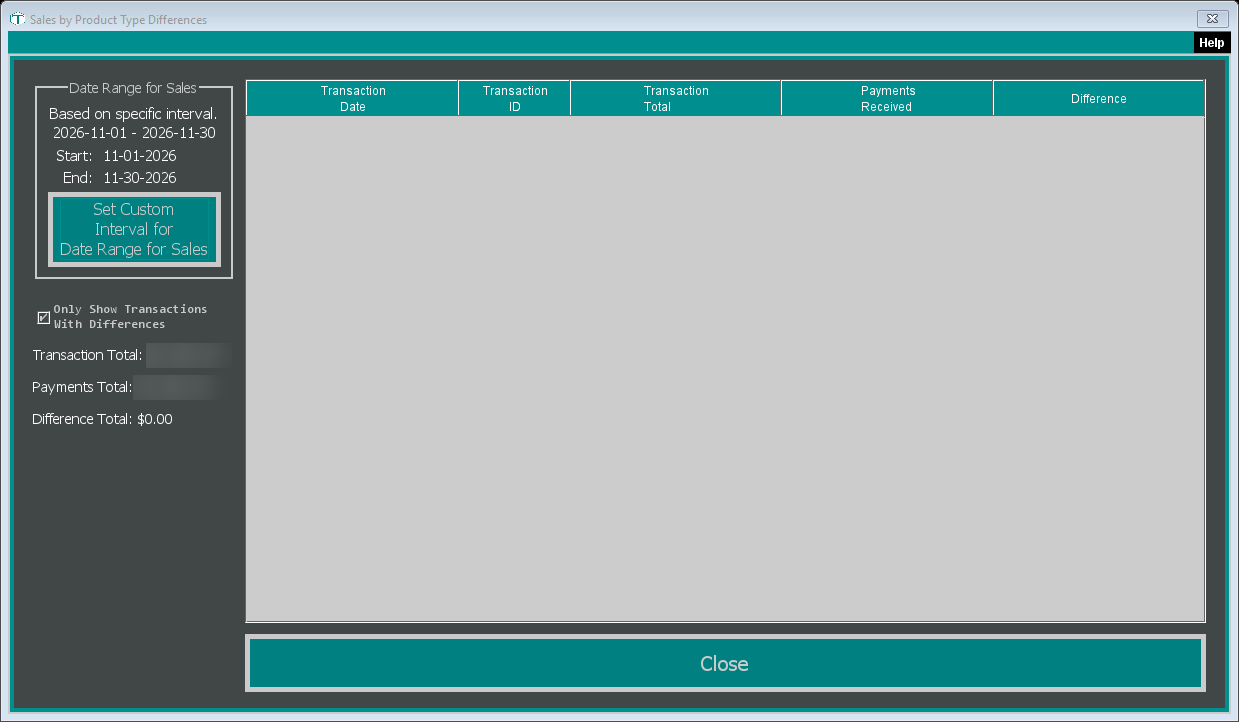
It opens on the same dates you were looking at in the main report. Use Set Custom Interval for Date Range for Sales to change them here.
It checks every sale in the range that has a payment on it and compares the sale's Transaction Total with the Payments Received on it. With Only Show Transactions With Differences ticked (the starting setting), only sales where those two disagree are listed, with the gap in the Difference column. Untick it to see every sale. On the left, Transaction Total, Payments Total and Difference Total add up the whole range.
Double-click a row to open that sale and see what happened.
If the list comes up empty, no sale in that range has payments that disagree with its total. The gap on the button then comes from the item lines themselves rather than from a sale's payments.
Exporting the Report
Click Export. TORO first asks for a save location, then opens the View, Email, or Print window, where you can Email the report or click View & Print to open it and print it. The exported report is titled Category Sales & Payment Types Report and includes both tables, the date range, and who created it.
The report isn't written to the location you pick in that first step, so use Email or View & Print to keep a copy.
Sales by Payment Type (Admin Menu)
This window looks at one month (or a whole year) at a time and is aimed at the cash side of things.
- On the main screen, click Admin in the sidebar on the left
- Click View Sales By Payment Type
- Enter your PIN if TORO asks
The window opens on the current month.
- Year and Month: pick the month to look at. The report reloads as soon as you change either one.
- View Annual Report: switches to the whole year shown in Year. Click View Monthly to go back to a single month.
- Calculations: the main table. Under Trans [MONEY IN] are the payment types that brought money in (cash, credit cards and similar), with their own Total. Under Trans [NO MONEY IN] are payments that didn't bring in new money, such as gift cards and comps, with their own Total. Below those are Gift Cards Sold, Virtual Gift Cards Sold and, when there were any, Coupons & Discounts. The % of Total column shows each line's share of its group.
- Cash Deposits For Period: Cash Sales minus Deposited Cash equals Need to Deposit, so you can see how much of the period's cash still has to go to the bank. The small table lists the bank deposits you've recorded for the period. As the yellow note says, this panel is just to show you the cash you recorded as deposited, and shouldn't be used to work out your sales tax.
- Record Deposit: opens the window for recording a bank deposit out of the safe. See Cash Drops and Safe Management for how deposits work.
- View Transactions for Selected Period: opens the transaction list for the same month or year.