The Advanced Reporting Module
TL;DR
Right now, you're making inventory and staffing decisions based on gut feel and memory. That's fine until you realize you've been sitting on $8,000 worth of slow-moving stock for six months — or that your margins on a whole product category are quietly eroding while your best sellers carry the weight. ARM shows you exactly where money is being made and where it's leaking out, across 37+ reports built specifically for tobacco retail. At $29/month for the Basic plan, that's less than a dollar a day to stop flying blind. The free trial runs through the end of next month and includes every report — start it now and see what your numbers have been trying to tell you.
The built-in reports in TORO cover the basics — daily sales, drawer counts, end-of-day summaries. But if you want to really understand your business — where money is being made, where it's leaking out, which customers are growing and which are drifting away — that's what the Advanced Reporting Module is for.
ARM is TORO's analytics engine. It takes everything your POS records every day and turns it into reports you can actually act on. It's a paid add-on (three plans, starting at $29/month) with a free trial — free for the rest of the current month plus a full month after that — so you can see if it's worth it before committing.
What You Get
ARM organizes its reports into categories you pick from the tabs down the left side: Store Requested, Loyalty, Sales, Inventory, Financial, Customer, Operations, and (for admins) High Risk Events. Here's what each is for.
Sales
How's the business doing? Sales by date, by product, by category, by payment method, by time of day, by day of week and hour. Compare this month to last month, this quarter to last year. See your best sellers, your worst performers, and everything in between. The Hourly Sales Analysis heatmap alone is worth the subscription — it shows you exactly when your store is busiest so you can staff accordingly. The Vendor Report Card also lives here.
Misc Line Items is the audit trail for everything rung up with the register's Miscellaneous Taxable and Miscellaneous Non-Taxable buttons. Because those are open-amount entries with no inventory item behind them, this report is the only place to see what they actually were: pick a month, a whole year, or any date range, and every misc line comes back with the description that was typed at the register, the amount, any discount, the sales tax collected, who rang it, and the transaction number. A dropdown at the top shows both types together or just taxable or just non-taxable — with the totals recalculating as you switch — and an Export CSV button hands the list (as filtered) to your bookkeeper.
Customer
Who are your best customers, and are you keeping them? Top Customers, Customer Lifetime Value, Purchase Frequency, Customer Acquisition (new vs. returning), Churn Analysis, and RFM Customer Segmentation (recency, frequency, monetary value). If a regular suddenly stops coming in, these reports catch it before you'd notice on your own.
Top Customers is the one most owners reach for first. Pick your dates, say how many names you want back, and you get a ranked list with each person's phone number and email on it — a call list, not just a chart. It shows what they spent, how many visits it took, your gross profit and margin on them, their average ticket, and when they were last in. A Move column shows whether each customer is climbing or sliding compared to the previous stretch of the same length, and flags anyone who wasn't buying at all before as NEW.
Locker Assignments answers a question that used to mean opening accounts one at a time: who has a locker? It lists every active customer with a locker number on their account, in locker order, along with their phone number, email and discount level. There are no dates to pick — a locker is either assigned or it isn't. Print it and walk the humidor to check the list against the doors, or use it as a call list when renewals come due. Lockers numbered any way you like still sort sensibly, including a customer who holds two (006 & 007 lands right after 005).
SMS Activity turns your text messaging into a picture. A line running month by month shows how many messages you sent, so the stretches where you leaned on texting stand out against the quiet ones. Underneath it, a second chart answers the question that actually matters: is the list growing? It tracks how many people subscribed each month, how many opted out, and the total size of your list over time, with a table below giving you the same figures month by month including the net change. Pick any date range, or choose All Time to go back to the very first message you ever sent.
Inventory
What do you have, what's it worth, and what should you reorder? Inventory Valuation, turnover rates, Inventory Aging (dead stock identification), and reorder point analysis. The ABC Inventory Analysis ranks every item by its contribution to revenue — so you know which 20% of your products drive 80% of your sales.
The Overstock Report answers the opposite question: where is your money stuck on the shelf? It compares what you have on hand against how fast it actually sells and tells you how long your stock will last — in days, months, or years. The first screen ranks every brand by the dollars tied up in excess inventory, so your biggest opportunities are at the top; click a brand to see item by item which products are sitting too long, slowest movers first. Anything that hasn't sold at all in the period is called out. You pick the sales period used to measure how fast things sell, and how many days of supply you consider healthy (90 by default) — everything past that counts as overstock. Stock you've only just started carrying is marked NEW and left out of the overstock totals, since it hasn't had a fair chance to sell yet.
Operations
Who's performing and who needs coaching, and how are your vendors treating you? Employee Performance, Labor Productivity (sales per labor hour), Supplier Performance, Vendor Cost Trends, returns and refunds, and payroll detail. The performance reports let you compare employees fairly, factoring in the hours and shifts they actually worked.
Tips & Commissions answers what an hour behind the counter actually earns. Pick a stretch of time — the last 3, 6 or 12 months, the year so far, all time, or your own dates — then pick one employee, a few to compare, or everyone who worked in that stretch. Tips and commission are graphed over time with one line per person, spaced by day, week or month to suit the range, and the tables underneath give each employee's days, hours, credit card tips, cash tips, commission and the per-hour average of each, plus the same figures period by period. It reads from the same time clock records payroll uses, so it always agrees with your payroll summaries.
Financial
The numbers your accountant asks for. Profit & Loss Summary, margin analysis, payment methods analysis, cash flow, and business valuation. They open in your web browser as clean, printable pages you can hand to your accountant or email straight over.
High Risk Events
Loss prevention without the paranoia. These reports flag patterns that might indicate a problem: excessive voids, unusual discounts, no-sale drawer opens, refunds without receipts, comps, and more. They're designed to surface anomalies for investigation — not to accuse anyone. Most flags have innocent explanations. The ones that don't are worth catching early. This category is only visible to admins and owners.
Plans & Pricing
ARM comes in three plans. Every plan includes the same free trial — you only choose a tier when the trial ends, and you can move up any time. Higher tiers simply unlock more reports; the ones you already have don't change.
- Basic — $29/month. The full set of everyday reports (39 of them): sales by period, product, category, and payment method; Top Customers; Locker Assignments; Misc Line Items; inventory turnover and valuation; the Overstock Report; employee performance; loyalty and customer engagement; discounts and comps; and the admin-only High Risk Events (voids, refunds without receipt, no-sale opens). For most shops, Basic is everything you need.
- Pro — $49/month. Everything in Basic, plus deeper analytics: Customer Lifetime Value, RFM Segmentation, Churn Analysis, Margin Analysis, Sales Trends & Forecasting, the Sales Dashboard, Cash Flow, Inventory Aging, Reorder Point Analysis, and Online Sales Performance.
- Enterprise — $69/month. Everything in Pro, plus the strategic reports: ABC Inventory Analysis, Basket Analysis, Business Valuation, Sales Forecast, Supplier Performance, Vendor Cost Trends, Company Report Card, Customer Trend Comparison, Employee Payroll, Tips & Commissions, and SMS Activity.
Getting Started
Open the Dashboard
Click the Advanced Reporting Module card. (Can't find it? Type "ARM" in the search box at the top right.)
If you haven't subscribed yet, you'll see the signup screen — start your free trial
Once active, pick a report category on the left and click a specific report
The report asks you for what it needs — a date range, and depending on the report, a product, category, employee, or comparison period
The finished report opens in your web browser
Reports support custom date ranges plus quick presets. Most include charts — bar, line, pie, and heatmaps — that make patterns visible at a glance, all laid out on a page you can scroll, print, or email.
Looking for something specific? Type it in the search reports... box at the top left and ARM searches every category at once — you don't need to know which tab it lives on. It matches on the report's name, its description, and the words you'd naturally use, so "theft" finds Price Overrides, "P&L" finds Profit & Loss Summary, and "till" finds Drawer Closing. Ctrl+F jumps straight to the box, and Esc clears it.
Making It Yours
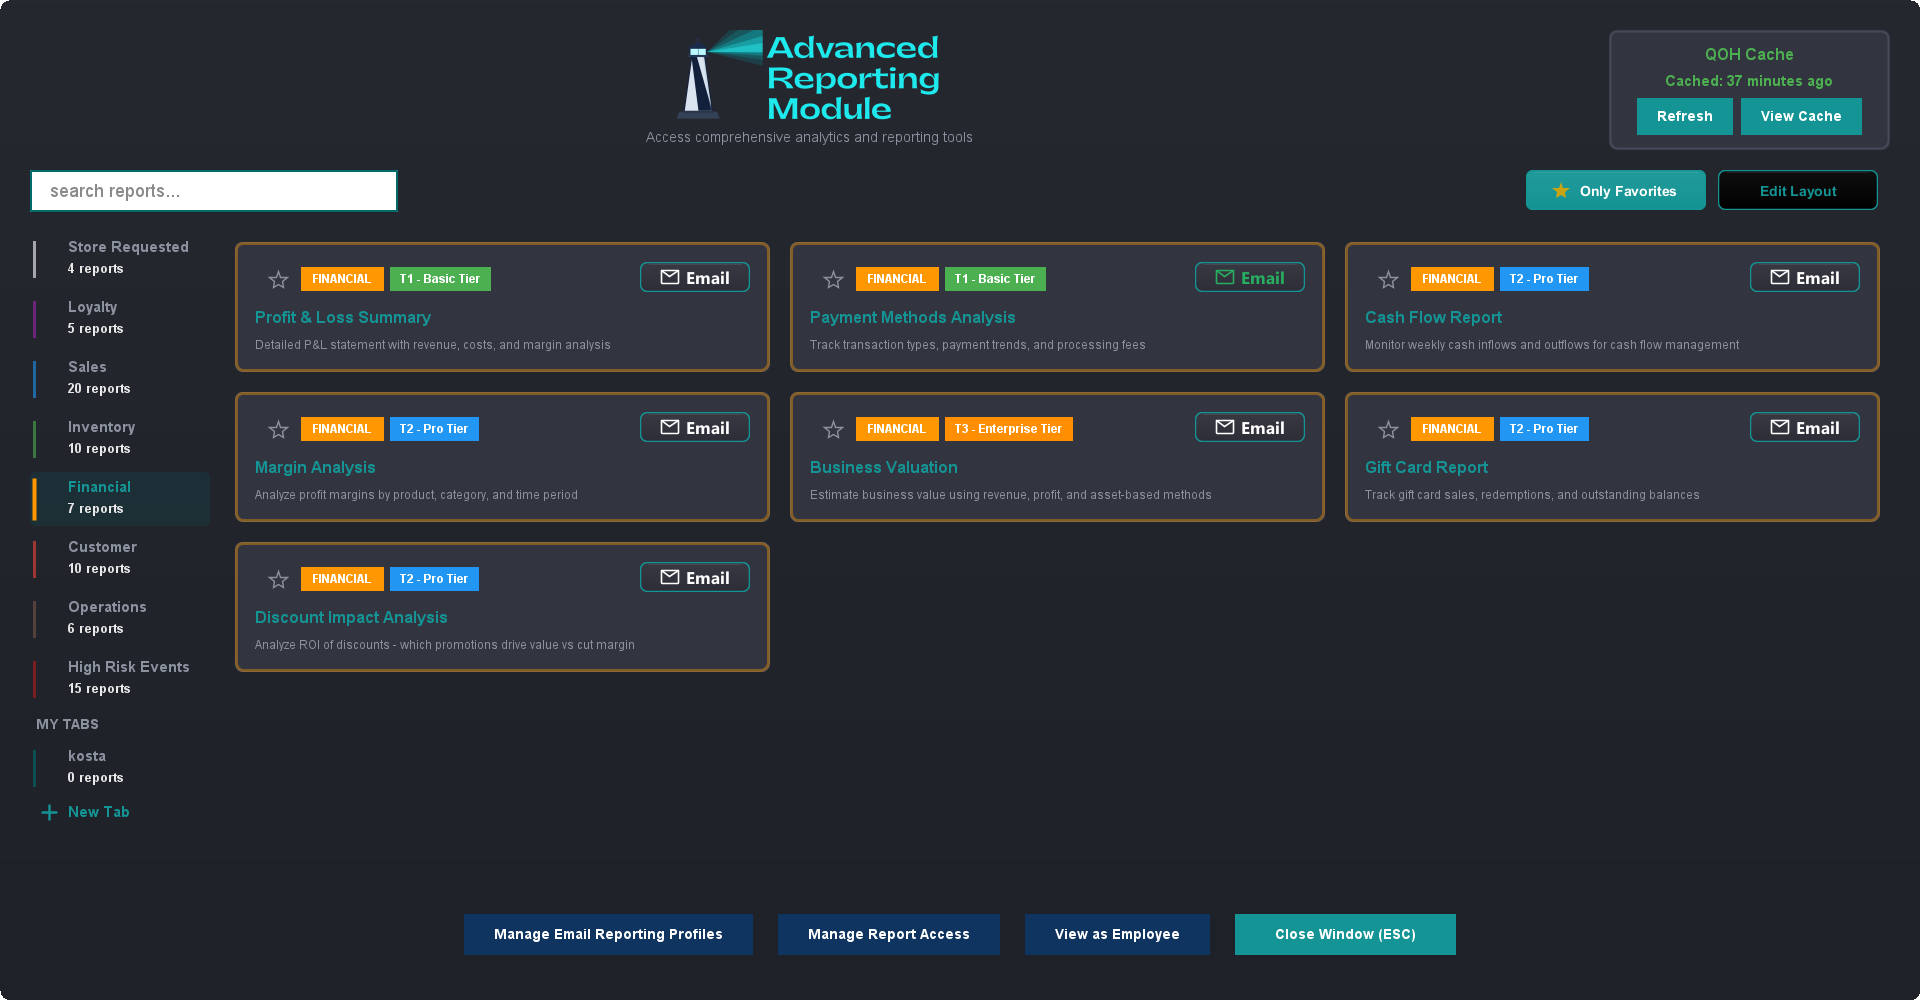
ARM has a lot of reports, but you probably live in five or six of them. Every employee can shape the module around the ones they actually use — your setup is yours, and it doesn't change what anyone else sees.
Star the ones you use. Click the star in the top-left corner of any report card and it moves to the top of that tab. Click Only Favorites at the top right to hide everything else. Haven't starred anything on that tab yet? ARM just shows you everything rather than an empty screen.
Build your own tabs. Click New Tab at the bottom of the category list, give it a name and a color, then right-click any report and choose Add to your new tab. A "Month End" tab with the six reports your accountant wants, or a "Monday Morning" tab with your weekly check — whatever matches how you actually run the place. Right-click a tab you've made to rename it, recolor it, or delete it. Deleting a tab never deletes the reports.
Put the cards where you want them. Click Edit Layout, then use the arrows on each card to move it. Click Done when you're happy. Favorites stay grouped at the top.
It remembers. Close ARM and open it tomorrow and you're back on the same tab with the same settings.
Managers and owners can also share a tab they've built: right-click it and choose Copy This Tab to Other Employees.
Choosing Who Sees What
Not every report belongs in front of every employee. Payroll, voids, comps and price overrides are the obvious ones, but you might also just want to keep a new cashier's screen simple.
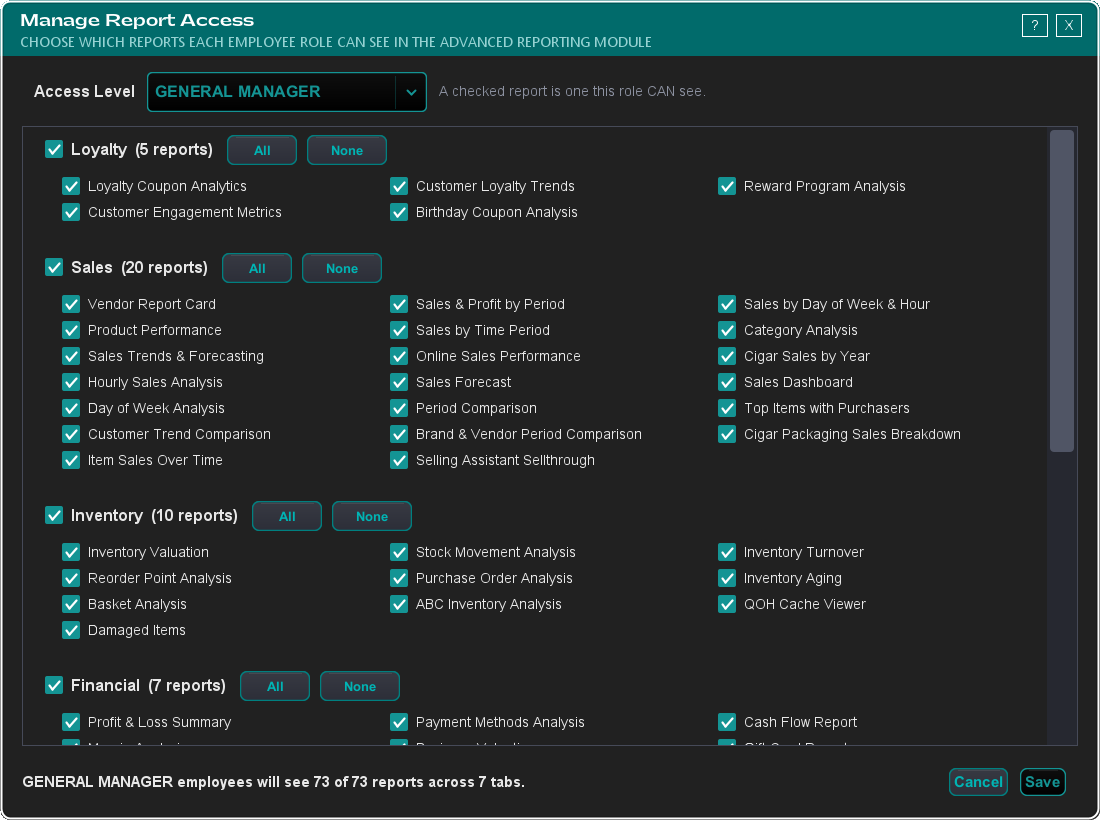
If you're an owner or admin, click Manage Report Access at the bottom of the Advanced Reporting Module. Pick an access level from the dropdown — General Manager, Shift Manager, Standard, and so on — and tick the reports that role can see. Anything you untick simply doesn't appear for them. The line at the bottom keeps a running count ("Standard employees will see 41 of 68 reports across 5 tabs") so you can see the shape of it at a glance.
Two things worth knowing:
Hiding a report isn't the same as revoking access. It takes the report off that role's ARM screen. It doesn't change anything else in TORO — if that employee reaches a report another way, like from an item's detail screen, it still works.
High Risk Events stays admin-only. That tab holds your loss-prevention reports, and it is only ever visible to admin users. You can hide reports inside it from other admins, but you can't switch it on for a non-admin.
Want to check your work? Click View as Employee, pick a member of staff, and ARM opens exactly as they see it. You can click report cards to switch them on or off from right there. Their own favorites and custom tabs aren't touched.
Changes take effect the next time that employee opens the module. Other registers pick them up after they restart.
The Free Trial
ARM comes with a free trial — free for the rest of the current month plus a full month after that. Sign up directly from the app. You get full access to every report during the trial. When it ends, you can subscribe (Basic, Pro, or Enterprise — see Plans & Pricing above) to keep access, or it simply deactivates with no further action needed.
Sharing Your Reports
Every report opens in your web browser as its own page — charts, tables, and all. From there you can print it, save it, or email it (more on that below). That makes it easy to:
Help your accountant — email them the financial reports they need without giving them POS access
Brief partners or investors — clean, formatted summaries of business performance
Keep your own records — archive monthly snapshots for year-over-year comparisons
Emailing Your Reports
Any report can go straight to someone's inbox — no need to run it, save a file, and attach it yourself. Every report card has an Email button in its top-right corner, and it gives you two ways to send:
Send Email Now — a one-off. Pick the report's options, set a subject, type in one or more addresses, and send. Works for every report, nothing to set up first.
Email Reporting Profiles — saved, repeating emails. Decide once which reports go out, to whom, and how often (daily, weekly, monthly, quarterly, or annually), and TORO delivers them on its own at close of business. This is how stores get a daily owner's recap or a monthly package to the accountant without lifting a finger.
Reports arrive as interactive HTML attachments — the recipient downloads the file and opens it in any browser. For the full walkthrough, see Emailing Your Reports.
Things to Know
Reports we build for you are yours to run. If we create a custom report for your shop at your request, it shows up under the Store Requested tab and works on your current plan — even if it's the kind of report that would otherwise sit on a higher tier.
Access is controlled by employee level. Not every employee should see every report. Use Manage Report Access to pick exactly which reports each role can see — see Choosing Who Sees What above. Admins always see everything, and the High Risk Events tab is admin-only regardless.
Reports pull live data. You can check today's numbers mid-shift. No waiting for end-of-day processing.
Large date ranges take longer. A report covering three years of daily data needs a moment to crunch. Use reasonable ranges for faster results.
ARM is always growing. New reports are added regularly based on what store owners actually ask for. If there's a question you wish ARM could answer, let us know.